In short: Open edX records everything that happens in a course, from enrollments and grades to every video play and problem attempt. Learning analytics turns that data into answers: which content works, where learners get stuck and how to improve. This guide explains what data Open edX produces, how to ask the right questions, and how Panorama, the analytics engine we build at Aulasneo, brings that data to staff and learners inside Open edX.
Why learning analytics matters
Have you ever had to decide which ice cream flavors to order, or whether to take the subway or the bus? Without noticing, you were doing data analysis: capturing the information in front of you, choosing what is relevant, cleaning it according to the circumstances, and reaching a conclusion that gives you the best result.
Online learning works the same way, at a much larger scale. Every course produces thousands of data points, and the question is how to turn them into better decisions. Three principles help:
- Define the problem first. "I want to know why my course is not working" is too broad. "I want to know in which units learners drop out and why" points the analysis to the data that matters and avoids superfluous or misleading results.
- Ask specific questions. "Which videos are watched the most?" is useful. "Which videos are skipped or rewound the most, and are they the longest ones?" is actionable.
- Clean and sort the data. Data is almost always incomplete. Good cleaning and sorting is what makes conclusions reliable.
Once analysis becomes part of a continuous improvement cycle, the results soon show up in completion rates, grades and learner satisfaction. Read more about measuring the impact of open courses with analytics.
What data Open edX generates
An Open edX platform collects two kinds of data:
- Operational data: users, enrollments, course structure, grades, progress, certificates, cohorts and discussion forums, stored in the platform's databases.
- Event data (tracking logs): a detailed record of learner interactions, such as playing, pausing or seeking a video, submitting an answer, opening a unit or posting in a forum.
Out of the box, instructors can download reports from the Instructor Dashboard (enrolled learners, grades, problem responses) and see basic course insights. The Open edX community also works on analytics tools for the platform. But as soon as you need to combine courses, compare cohorts, follow learners over time or mix Open edX data with other systems, you need an analytics engine.
Questions you can answer with learning data
The questions are practically infinite. These are two examples of behavioral analysis we run for our clients.
How learners use videos
By video: How many times was it viewed? Which part was watched? How many times was it rewound or fast-forwarded, and at which points? How long did it take from the first "play" to the end?
By learner: How many videos did they skip? How many did they start and not finish? How many hours did they spend watching videos?
Combining both views reveals patterns: are the most skipped videos the longest ones? Are the most rewound ones from the same course, or explaining the same concept? Who are the most and least active learners, and do they belong to the same cohort?
How learners answer assessments
How many times was a question answered correctly, and how many incorrectly? How many learners got it wrong (remember that a learner may fail the same question several times)? Which questions were skipped? Which ones were the easiest and the hardest?
The value of analysis is not only in asking good questions, but above all in what comes after: using that information to improve the learning experience for everyone, by rewriting a confusing unit, splitting a long video or adding practice where learners struggle.
Panorama: analytics for Open edX and beyond
Panorama is the learning analytics engine we develop and maintain at Aulasneo since 2020. Its data connector is open source, and it gives institutions a complete picture of what happens in their virtual campus, with customizable dashboards and advanced filters.
Two needs shaped its design:
- More than one platform. Medium and large institutions often have more than one LMS: different schools or departments may run their own, of the same or different brands and versions. And the LMS is only part of the learning ecosystem, next to videoconferencing, surveys, student information systems, e-commerce and marketing tools. Panorama combines data from all of them for richer analyses. Read more about Panorama's cross-platform approach.
- The right data for each person. Data must be available only to authorized users, at department, organization or institution level. Panorama supports row-level security to meet data ownership policies.
How Panorama works
Panorama's architecture rests on three pillars:
- Extraction agents: distributed processes that connect to each data source and periodically copy its data, using incremental updates and partitioning so that operational systems are not affected. For Open edX, this is Panorama ELT, our open-source connector.
- Data lake: flexible, scalable storage for structured, semi-structured and unstructured data, in multiple formats and with virtually unlimited capacity.
- Data pipeline: SQL transformations that turn raw data into platform-independent objects, remove duplicates across systems so each entity has a unique representation, and allow joins, unions and filters even between heterogeneous sources.
We presented this architecture at the IEEE Learning with MOOCs (LWMOOCs) conference at MIT in October 2023.
What institutions use it for
- Business intelligence: dashboards and reports that combine data from several sources.
- Data standards: adopting standards such as the Common Education Data Standards (CEDS) and SIF specifications.
- Machine learning and AI: a consolidated, clean data set is the basis for more accurate models.
Panorama inside Open edX: for staff and for learners
Since the Open edX Palm release, Panorama integrates with Open edX as a micro-frontend. Staff users open it from the header of the learning experience, in the same browser tab and with the same login.
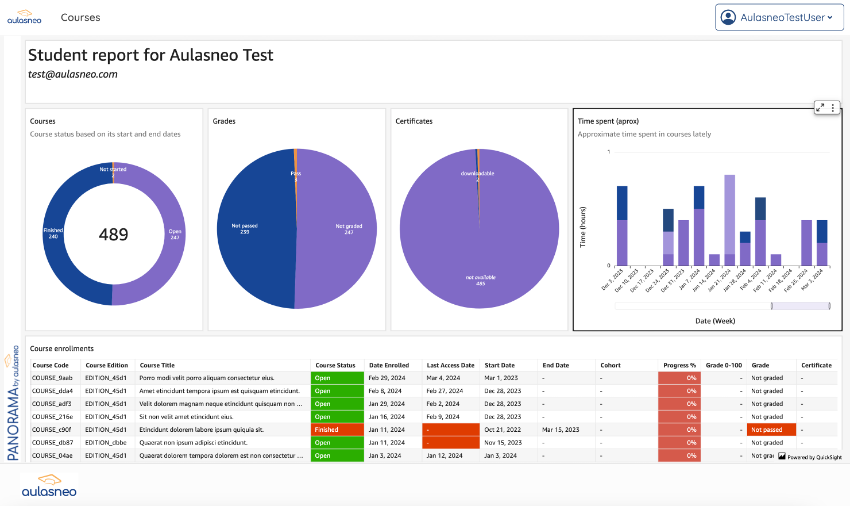
It also offers a student view: learners see their own information (enrolled courses and dates, grades, certificates, progress and time spent in courses), filter it and export their own data to track their achievements. By default, site administrators see the institutional reports and everyone else sees the student view, so analytics are actionable for every role.
Managing access to data
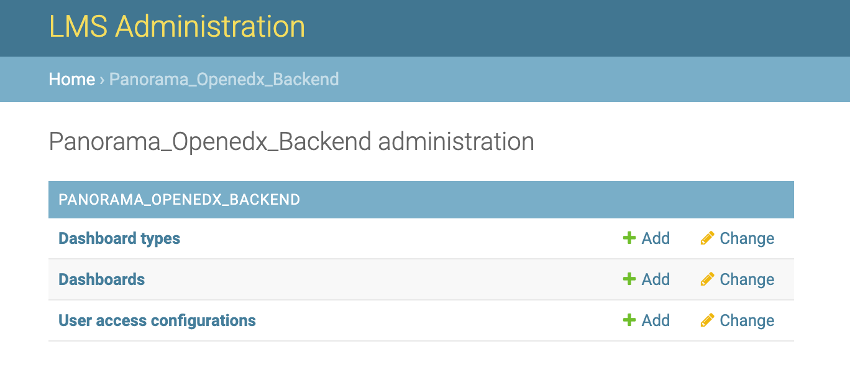
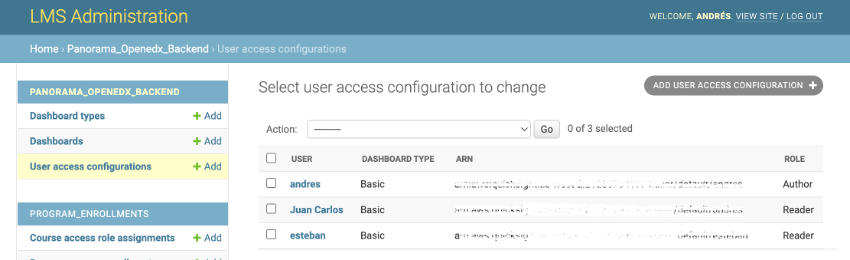
In large organizations, different teams need different information. Site administrators assign groups of dashboards to each user from the Open edX administration panel, and decide which dashboards can appear in the student view. Users can be readers or authors: authors create their own dashboards and share them with readers. Users with AI features enabled can ask questions in natural language to get insights or build complete dashboards.
How to get Panorama
Panorama connects to any Open edX instance, whether Aulasneo runs it or not. It has two layers, and you can choose how far to go with each one.
The open-source connector: free
Panorama ELT is the extract-and-load connector: it reads the Open edX databases and leaves the data in a data lake, ready for analysis. It is open source and free, and installs on Tutor-based platforms with the Panorama Tutor plugin.
With the connector alone, your team can build its own data pipeline and use the visualization tool of its choice, such as Power BI, Tableau or Apache Superset.
The data pipeline and dashboards: Panorama analytics
On top of the connector, Panorama adds the data pipeline that cleans and models the data, the ready-to-use dashboards, the embedded view inside Open edX for staff and learners, access control and the AI features. Aulasneo offers it in two ways:
- As a service: we run Panorama for you in the cloud. It is the most convenient option in most cases, in infrastructure costs, operating effort and implementation time. It is included in Aulasneo's managed Open edX Gold plan and higher. For other Open edX sites, Panorama is also available on its own, with Pro and Enterprise plans (see plans and pricing).
- In your own infrastructure: if you need full control of the data, we install Panorama in your infrastructure as a turnkey project, and you can operate it yourself or with our support.
Panorama works with Open edX releases from Ironwood onward, and its micro-frontend with Palm and later. If your Open edX is older than Palm, contact us to assess the options, or check what you would gain by upgrading in our Open edX release notes explorer.
See Panorama in action in the Cap-Net UNDP success story, where it supports a global capacity-building campus on Open edX.